

How to Measure the Impact of the H2A Program: Key Metrics for Ag Operations to Monitor
The H2A Visa Program provides farms and ag businesses with essential seasonal farm labor to ensure they have sufficient help to produce a profitable harvest. In a previous blog, we talked about the importance of running your ag operation as a business. Beyond simply providing extra hands to perform necessary tasks, the H2A Program should be seen as an investment and measured like any major operating expense to determine the full contribution to the bottom line.
Simply looking at how many H2A Program workers you requested and successfully arrived doesn’t paint an adequate picture. It doesn’t help you understand how good a fit the workers were, how their performance measured up to your expectations, and many more important insights that can help you assess your investment for the current season and make informed decisions for the following season. This blog is designed to provide ag businesses with a helpful approach and meaningful metrics to assess the full value of the H2A Visa Program.
Keep it simple with a high-level view
If you simply want to get a 10,000 ft. view of how the H2A Program is benefiting your operation, you can measure these five fundamental things:
Did we get the workforce we needed?
Did the workers perform effectively?
What did the workforce actually cost us?
Did the workforce create operational/compliance problems?
Did the H2A Program improve our overall farm performance compared with alternatives?
Key metrics to perform an in-depth H2A Program assessment
There are many metrics you could track to assess all the ways the H2A Visa Program may impact your ag operation. The ultimate goal would be to understand, "Did our H2A Program workforce produce a reliable, productive, cost-effective and compliant workforce that helped us achieve our farm's production objectives?"
Here are some of the most meaningful categories to look at along with specific items to measure within each one. Tracking these metrics can also help reveal potential problem areas and suggest ways to make improvements.
Retention
Return-worker rate, specifically:
Eligible return rate: How many workers you wanted back who actually returned
Overall return rate: How many workers from the prior season returned, regardless of whether you specifically requested them
High-performer return rate: How many of your best-performing workers returned
Early departures
End-of-season completion
Productivity
Measure at the job level:
Crop operation: Acres completed ÷ labor hours
Planting: Rows planted ÷ labor hours
Pruning: Trees/vines pruned ÷ labor hours
Packing: Boxes packed ÷ labor hours
Livestock: Animals processed/handled ÷ labor hours
You can also assess productivity in terms of ramp-up costs.
For example:
Productivity ramp-up cost = expected production – actual production during training/ramp-up period
New workers reach 90% of expected production after 8 working days.
Compare that with:
Returning workers reach 90% of expected production after 2 days.
It might also be useful to compare:
Your current H2A Program workforce vs. prior H2A Program workforce
Your H2A Program workforce vs. domestic workforce
Returning workers vs. first-year workers
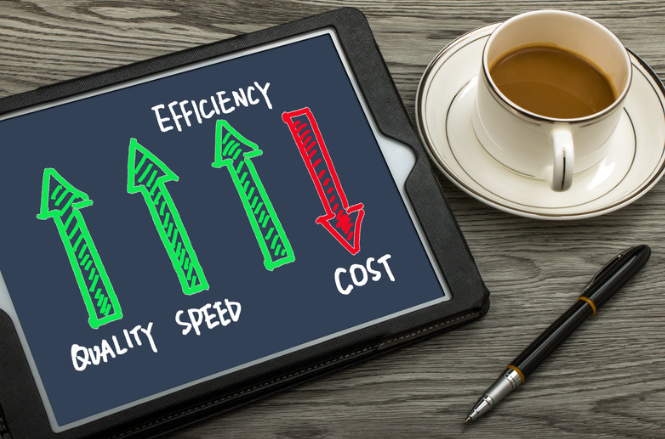
Efficiency
Measure labor efficiency separately from productivity.
Productivity asks: How much did we produce?
Efficiency asks: How much labor did it take to produce it?
Consider:
Labor hours per acre
Labor hours per 1,000 plants
Labor cost per acre
Labor cost per head of livestock
Attendance
Separate into four categories:
Scheduled absence: Approved/scheduled days off
Excused absence: Illness, injury, emergency, etc.
Unexcused absence: Worker doesn’t report
Late arrival: Worker arrives after the scheduled start time
Then calculate:
Absenteeism rate = Unscheduled hours/days absent ÷ scheduled hours/days
Also track lost labor hours due to absenteeism
For example:
20 workers × 8 hours × 3 unplanned absence days = 480 lost labor hours
Turnover
Distinguish when workers leave by measuring:
Early turnover: Workers who leave during the first 30 days
Mid-season turnover: Workers who leave before the midpoint
Late-season turnover: Workers who leave before completing the contract
Contract completion rate: Workers who remain through the expected end of the contract
If workers are leaving in the first two weeks, the problem may involve:
Recruiting expectations
Job description
Worker-job matching
Onboarding
Housing
Transportation
Supervision
Working conditions
If workers leave near the end of the season, the underlying issues could be different.
It can also be helpful to track the cost of replacing a worker. Suppose a worker leaves unexpectedly. The replacement cost might include:
Recruiting
Transportation
Onboarding
Training
Supervisor time
Lost productivity
Overtime for remaining workers
Crop delay
Administrative work
Add all of the above to get a total, then multiply that by the number of unexpected departures. This provides a tangible economic reason to invest in retention and returning workers.
Recruiting
Recruiting cost/worker
Cost/qualified worker
Cost/returning worker
In addition to looking at recruiting costs, you can measure the effectiveness of your recruiting efforts by tracking the following stages:
Workers requested
Workers applied/interviewed
Workers selected
Workers approved
Workers that arrived
Workers that started working
Workers that completed their contract
Workers returning the following season
Calculate conversion rates at every stage:
Selection rate: Selected ÷ applicants
Approval rate: Approved ÷ selected
Arrival rate: Arrived ÷ approved
Start rate: Started ÷ arrived
Completion rate: Completed ÷ started
Return rate: Returned ÷ eligible workers
This helps distinguish whether issues have to do with recruiting, arrival, or retention.
Financial
Total H2A Program cost
Labor cost/unit
Cost as a percentage of revenue
The hourly wage isn't your total cost. Calculate the true cost per H2A Program worker, including:
Wages
Payroll costs
H2A Visa Program/application costs
Recruitment costs
Visa-related costs
Transportation
Housing
Meals/subsistence
Onboarding/training
Administration/compliance/recordkeeping
Then calculate:
Cost per worker: Total H2A Program workforce cost ÷ number of workers
Cost per labor hour: Total H2A Program workforce cost ÷ productive labor hours
Cost per unit of production: Total H2A Program workforce cost ÷ units produced
Quality
First-pass quality rate: Acceptable units on first inspection ÷ total units inspected x 100
Crop damage: Damaged units ÷ units handled x 100
Rejected product: Rejected units ÷ total units harvested/packed x 100
We recommend you compare H2A Program workers against a baseline vs. just other workers. Two important baselines could be this season compared to the previous season, and comparing new versus returning H2A Program workers.
Compliance
Violations
Payroll errors:
Wage rate
Hours recorded
Deducations
Missed payment
Pay statements
Job Order:
Worksite accuracy
Crop/activity accuracy
Recruitment:
Applicant records
Hiring/rejection documentation
Recruitment report completeness
Housing:
Inspections
Repairs
Safety issues
Complaints
Transportation:
Vehicle inspections
Driver qualifications
Transportation incidents
Recordkeeping/documentation:
Worker contracts/Job Orders provided
Required records maintained
Separation notifications where applicable
Management
Supervisor hours
Training hours
Worker questions/complaints/issues
Time spent resolving worker disputes
Disciplinary incidents
Housing and transportation issues
Then calculate: Management hours per H2A Program worker

Business impact
Ultimately, the H2A Visa Program exists to support your farm's operation, so tracking business outcomes is essential.
Production
Acres harvested
Units harvested
Yield
Harvest completion
Production per labor hour
Timeliness
Percentage of harvest completed on schedule
Days behind/ahead of schedule
Missed harvest windows
Loss avoidance
Estimate the production that would’ve been lost without adequate labor.
Calculate an H2A workforce ROI
Estimate the economic value of, and document the assumptions behind the estimate, for the following:
Additional acreage harvested
Reduced crop loss
Increased production
Improved timeliness
Lower turnover
Returning-worker productivity
Reduced overtime
Reduced recruitment costs
Workforce reliability
Based on:
% of requested workers received vs. requested
% arriving on time
Absenteeism
Turnover
Contract completion
Productivity
Return-worker rate
For example:
Metric Target
Workforce filled ≥ 95%
On-time arrival ≥ 95%
Contract completion ≥ 95%
Unplanned absenteeism ≤ 3%
Return-worker rate ≥ 80%
Productivity vs. target ≥ 90%
Compliance deficiencies 0 critical
The individual metrics are informative because they show where the problems lie.
Top 15 H2A Program KPIs
You choose how general or granular you want to get when measuring the impact of the H2A Visa Program. We recommend prioritizing these 15 measurements to get a comprehensive assessment.
Workforce
Workers requested vs. received
Worker arrival rate
Return-worker rate
Contract completion rate
Turnover rate
Attendance/productivity
Unplanned absenteeism
Productivity per labor hour
Labor hours per unit
Time to productivity for new workers
Financial
Total H2A Program cost per worker
Total H2A Program cost per productive labor hour
Labor cost per unit produced
Recruiting/replacement cost per worker
Compliance
Compliance deficiencies/incidents
Job Order/actual work discrepancies
Then add production achieved vs. production plan as the overarching business outcome.
USA Farm Labor helps you get the most out of the H2A Visa Program
USA Farm Labor strives to create long-lasting relationships with ag operations, delivering far more than certifications and workers. Our goal is to help you build a more predictable, seasonal farm labor workforce and support you and your workers all season long, as well as help you plan for and improve each and every season.
